Configuration
Unfortunately we are not able at the moment to provide a detailed manual for using the XVA pricer. This function requires a large number of inputs and is rather complex. If you would like to use it and need help, please contact us.
The interface is meant to be self-explanatory as much as possible. As for other items in SDev, it is easiest to start from the examples and do ‘Save As’ to create your own.
When using non-analytic exposure types (Trade or Set regressions), and when checking the ‘Store Regressions’ flag the Regression Viewer will appear.
Regression Viewer
The American Monte-Carlo algorithm is used for several purposes that may or may not be relevant to the chosen configuration: trade-level regression, netting set-level regression, callability decision, or trade underlying regression (for callables). When relevant, regression dates will be displayed. Double-clicking on them will draw the regression chart. Beware that for display performance reasons, we currently only display a subset of the simulated points. Regression algorithms can be chosen on the lower tab ‘Exposure Config.’.
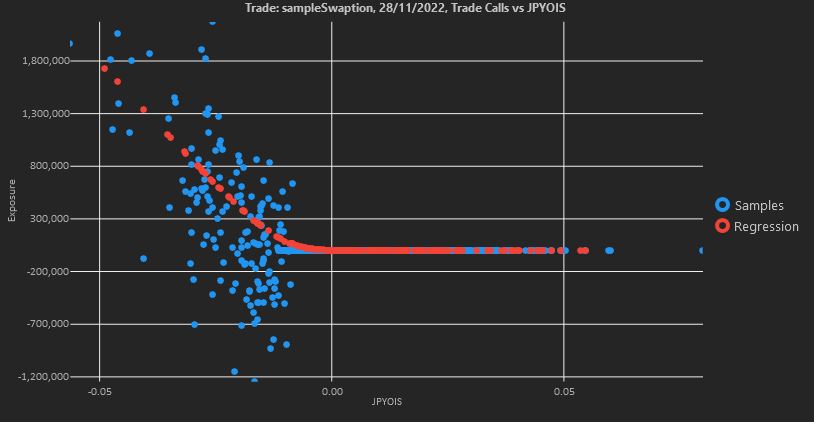
The effect of the regression algorithm may be seen in the following example. See below the exposure of a physically settled swaption using a global polynomial regression
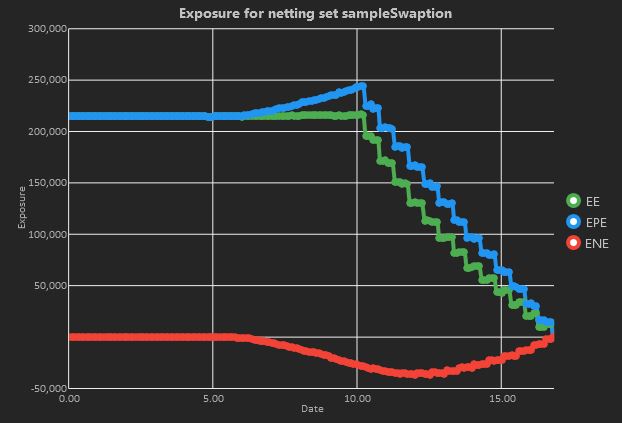
where we can observe slightly negative exposures before expiry. Corresponding to this, a typical regression chart will look as
where we can see that a polynomial cannot accurately fit the option shape over the whole range of the regression variable.
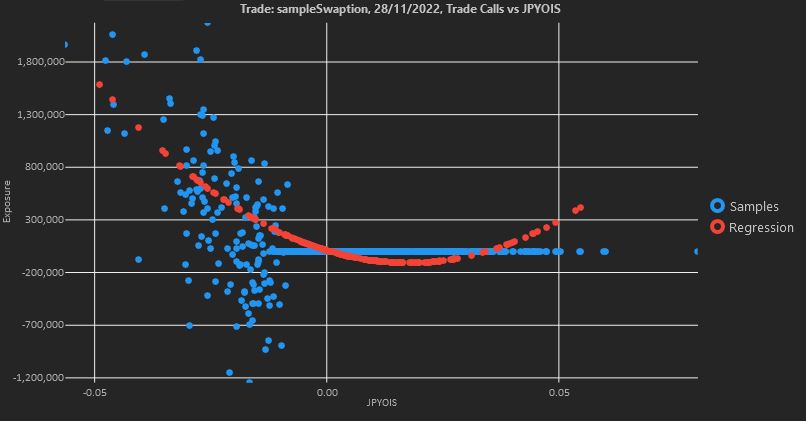
However, once choosing the LOESS method the exposure profile
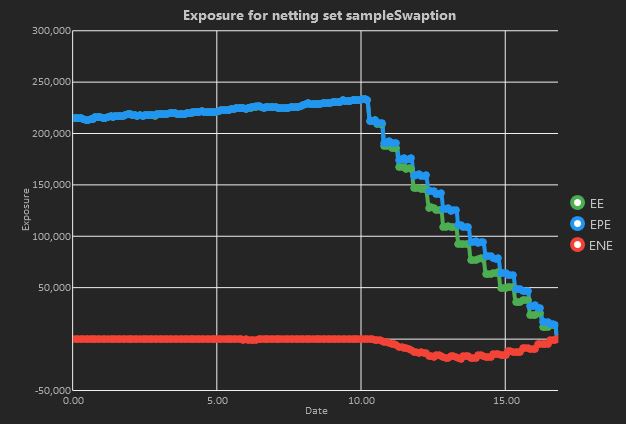
no longer generates negative exposures before expiry, while the regression has succeeded to capture the payoff shape over the whole range